2.2 The RStudio Interface
When you open RStudio, you’ll see an interface like the one shown below. It’s possible that the four windows highlighted in the image will be in a different order. Note that you can change the size of the windows by dragging the panes separating them.
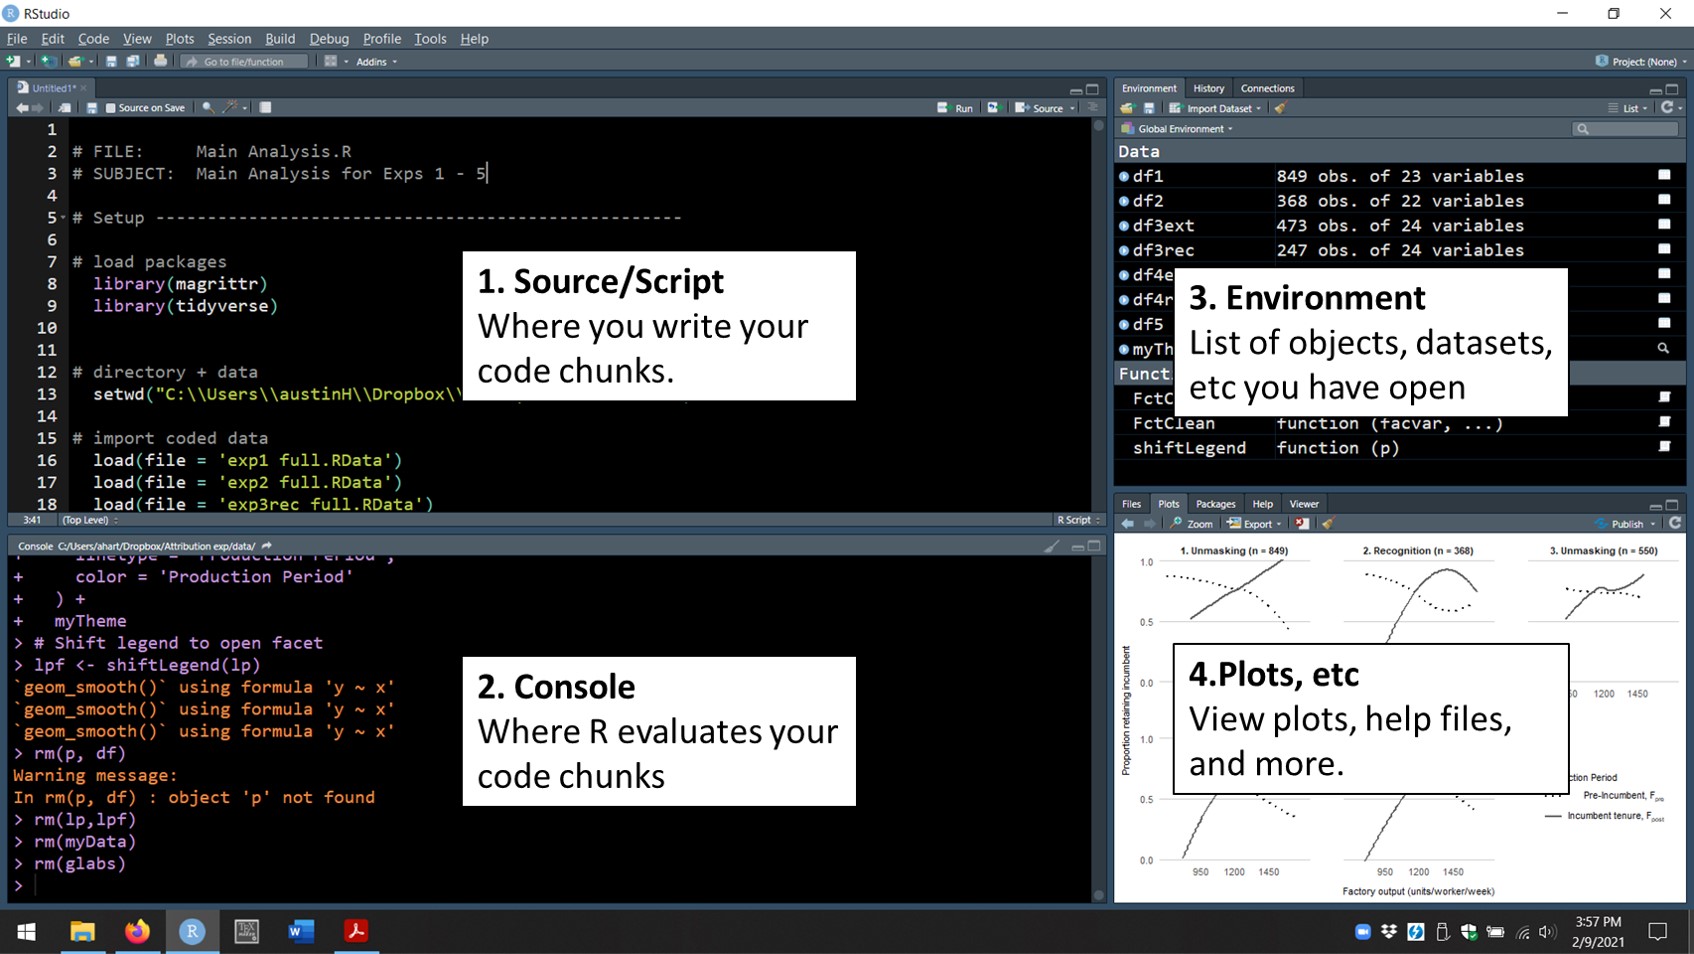
FIGURE 2.1: RStudio Interface
The source pane is where you’ll write individual scripts: the collections of R code chunks that constitute your analysis. The console is where R evaluates the code you choose to execute. Each code chunk in the console begins with the symbol >, and the output from each chunk is printed below it. For example, type 2+10/5 into the console and hit enter.
  2 + 10/5
## [1] 4
The environment pane displays the objects (dataframes, graphs, lists, etc) available. Finally, the plots/help panel displays your graphs, help files, and more. For example, load a built-in data frame and create a simple histogram. Type and execute the code below:
  IrisData = iris

  hist(IrisData$Petal.Width)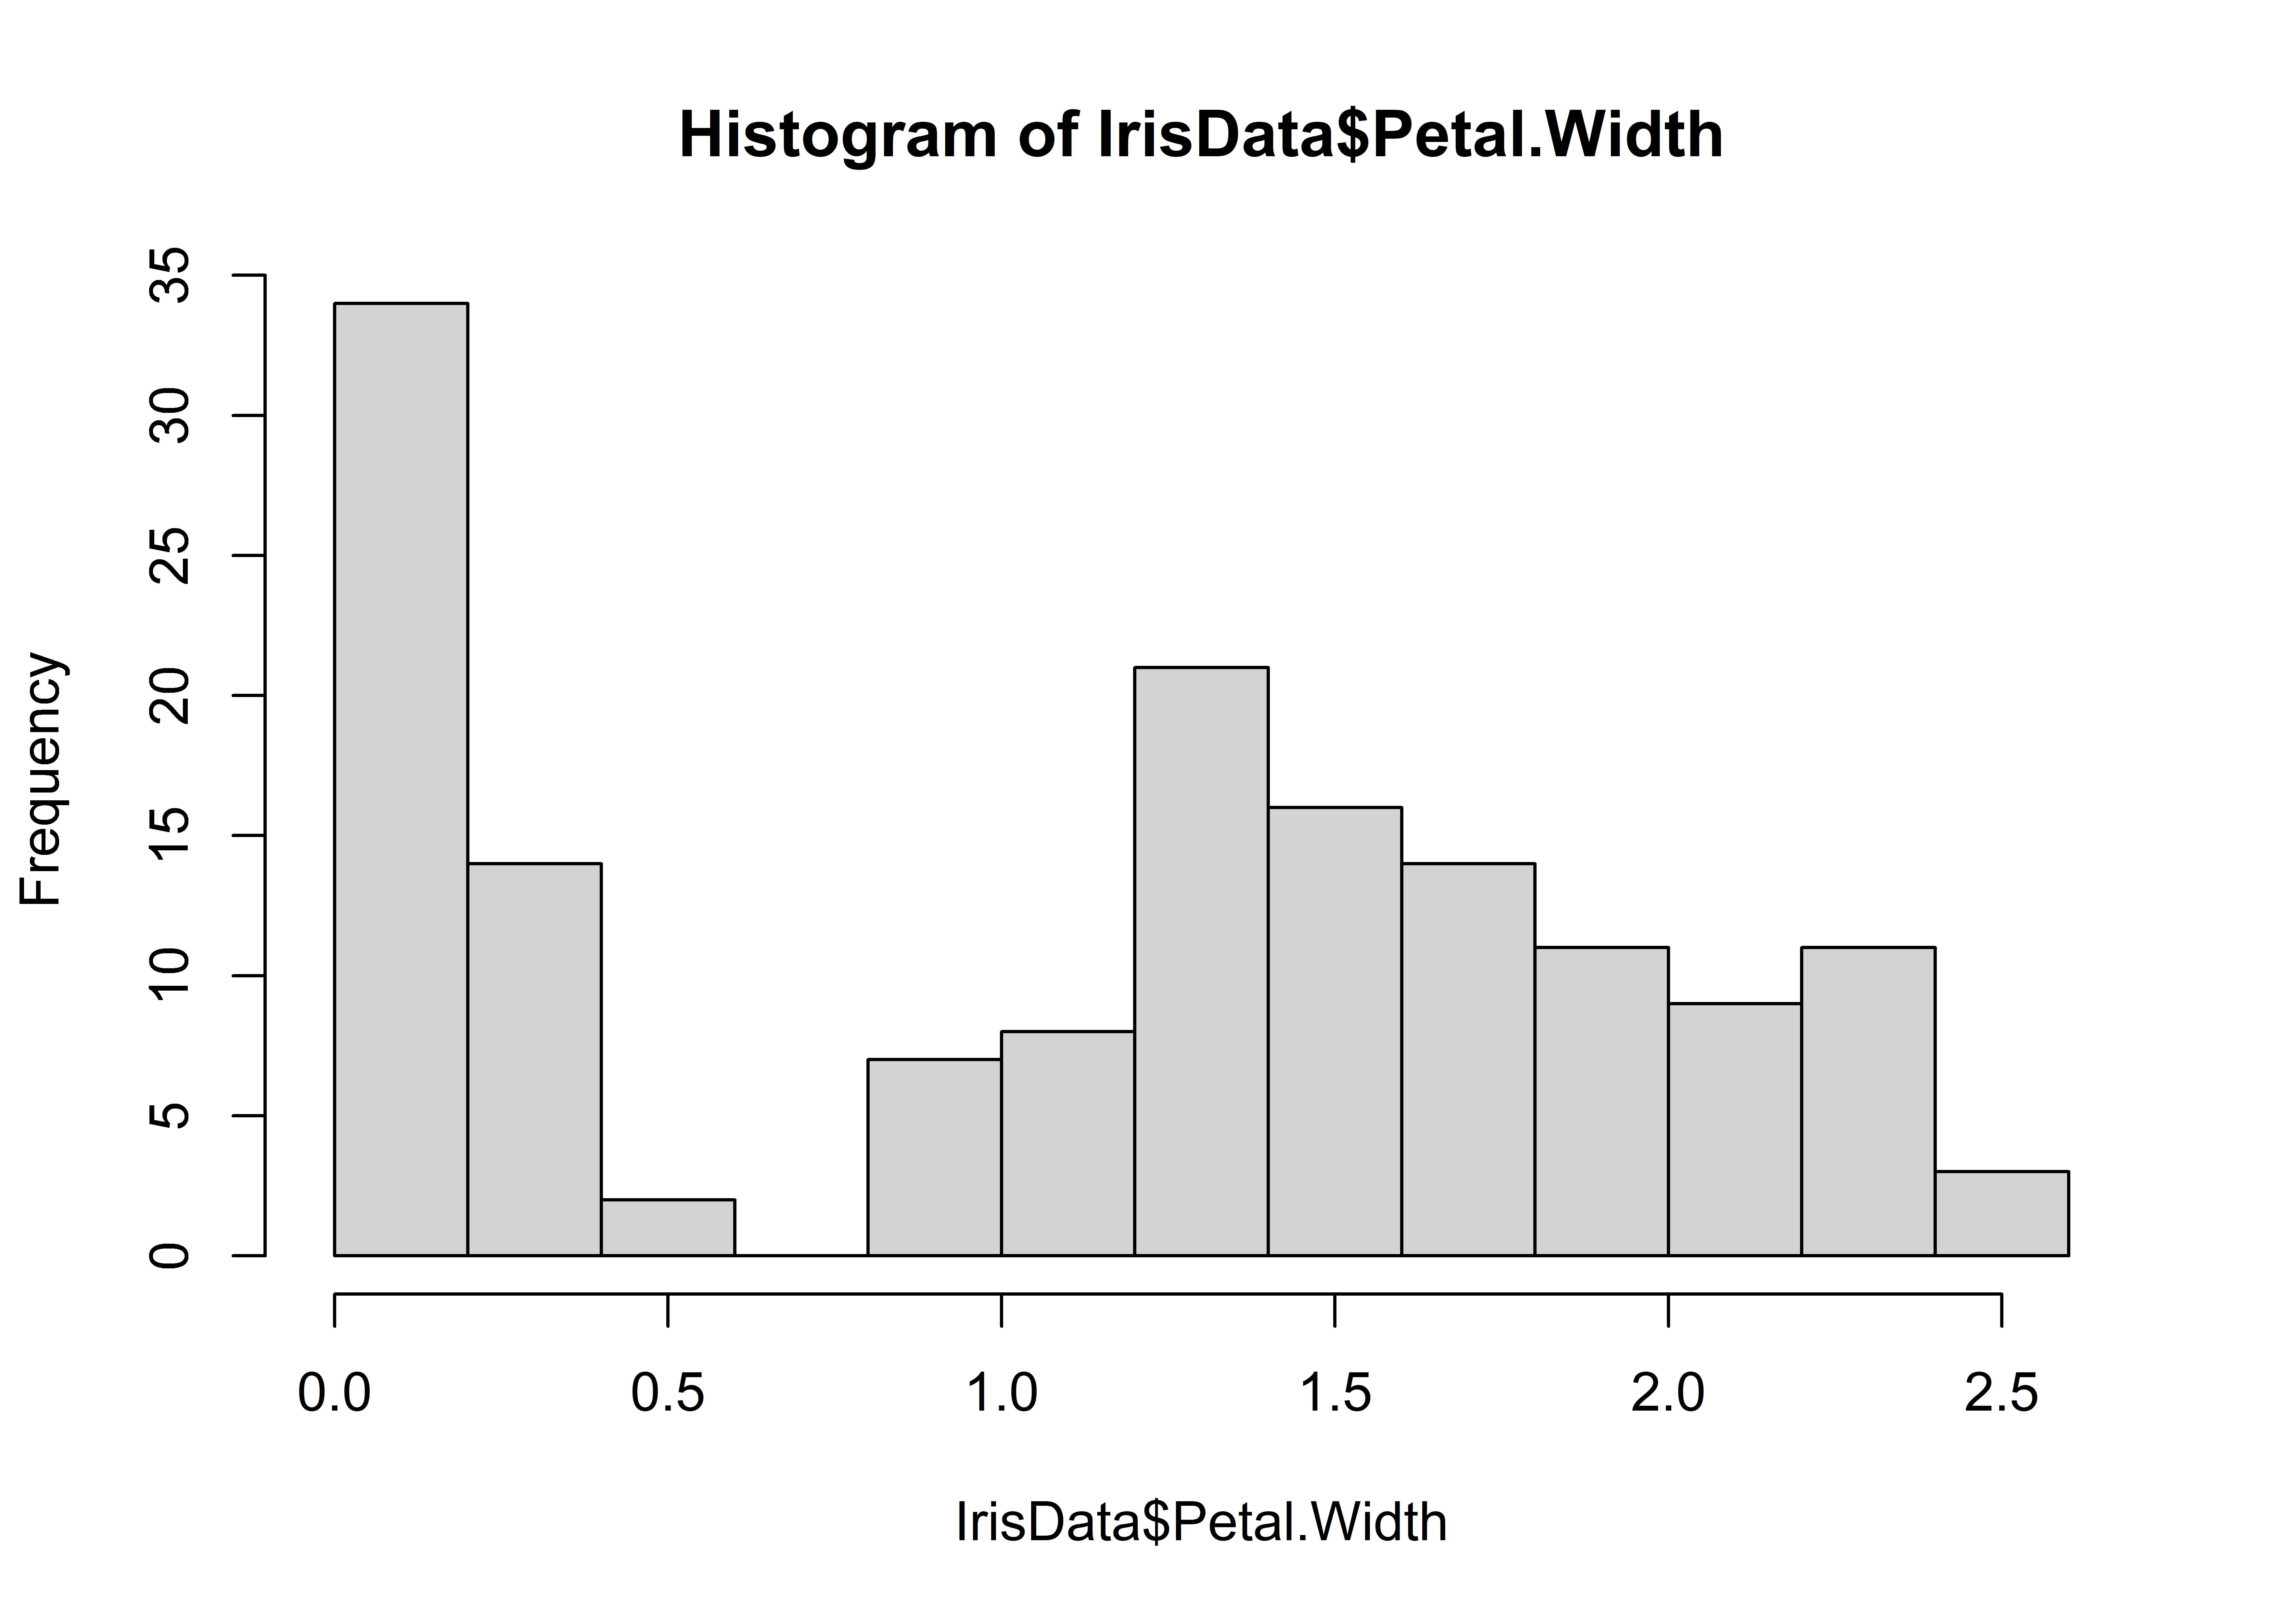
Notice that the data frame IrisData is now listed in the environment pane. The histogram is displayed in the plot window.