9.2 Professional formatting
Formatting is what differentiates an exploratory graph from one you would present to others. The options for formatting an R graphic are almost limitless. However, of special importance are the descriptive text (e.g. titles), axis scales, and the graphical parameters (e.g. color and shape of the points).
I suggest the Quick-R Advanced Graphs page for more details and for more advanced examples.
9.2.1 Titles and labels
Within the different plotting functions, you can specify the main title (main =), axis labels (e.g. xlab =), and more. Choose simple, descriptive labels and titles.
  hist(dcps$ProfLang,
       main = "Language Proficiency, DCPS 2018",
       xlab = 'Grade-level proficient (% tested)', ylab = 'Frequency')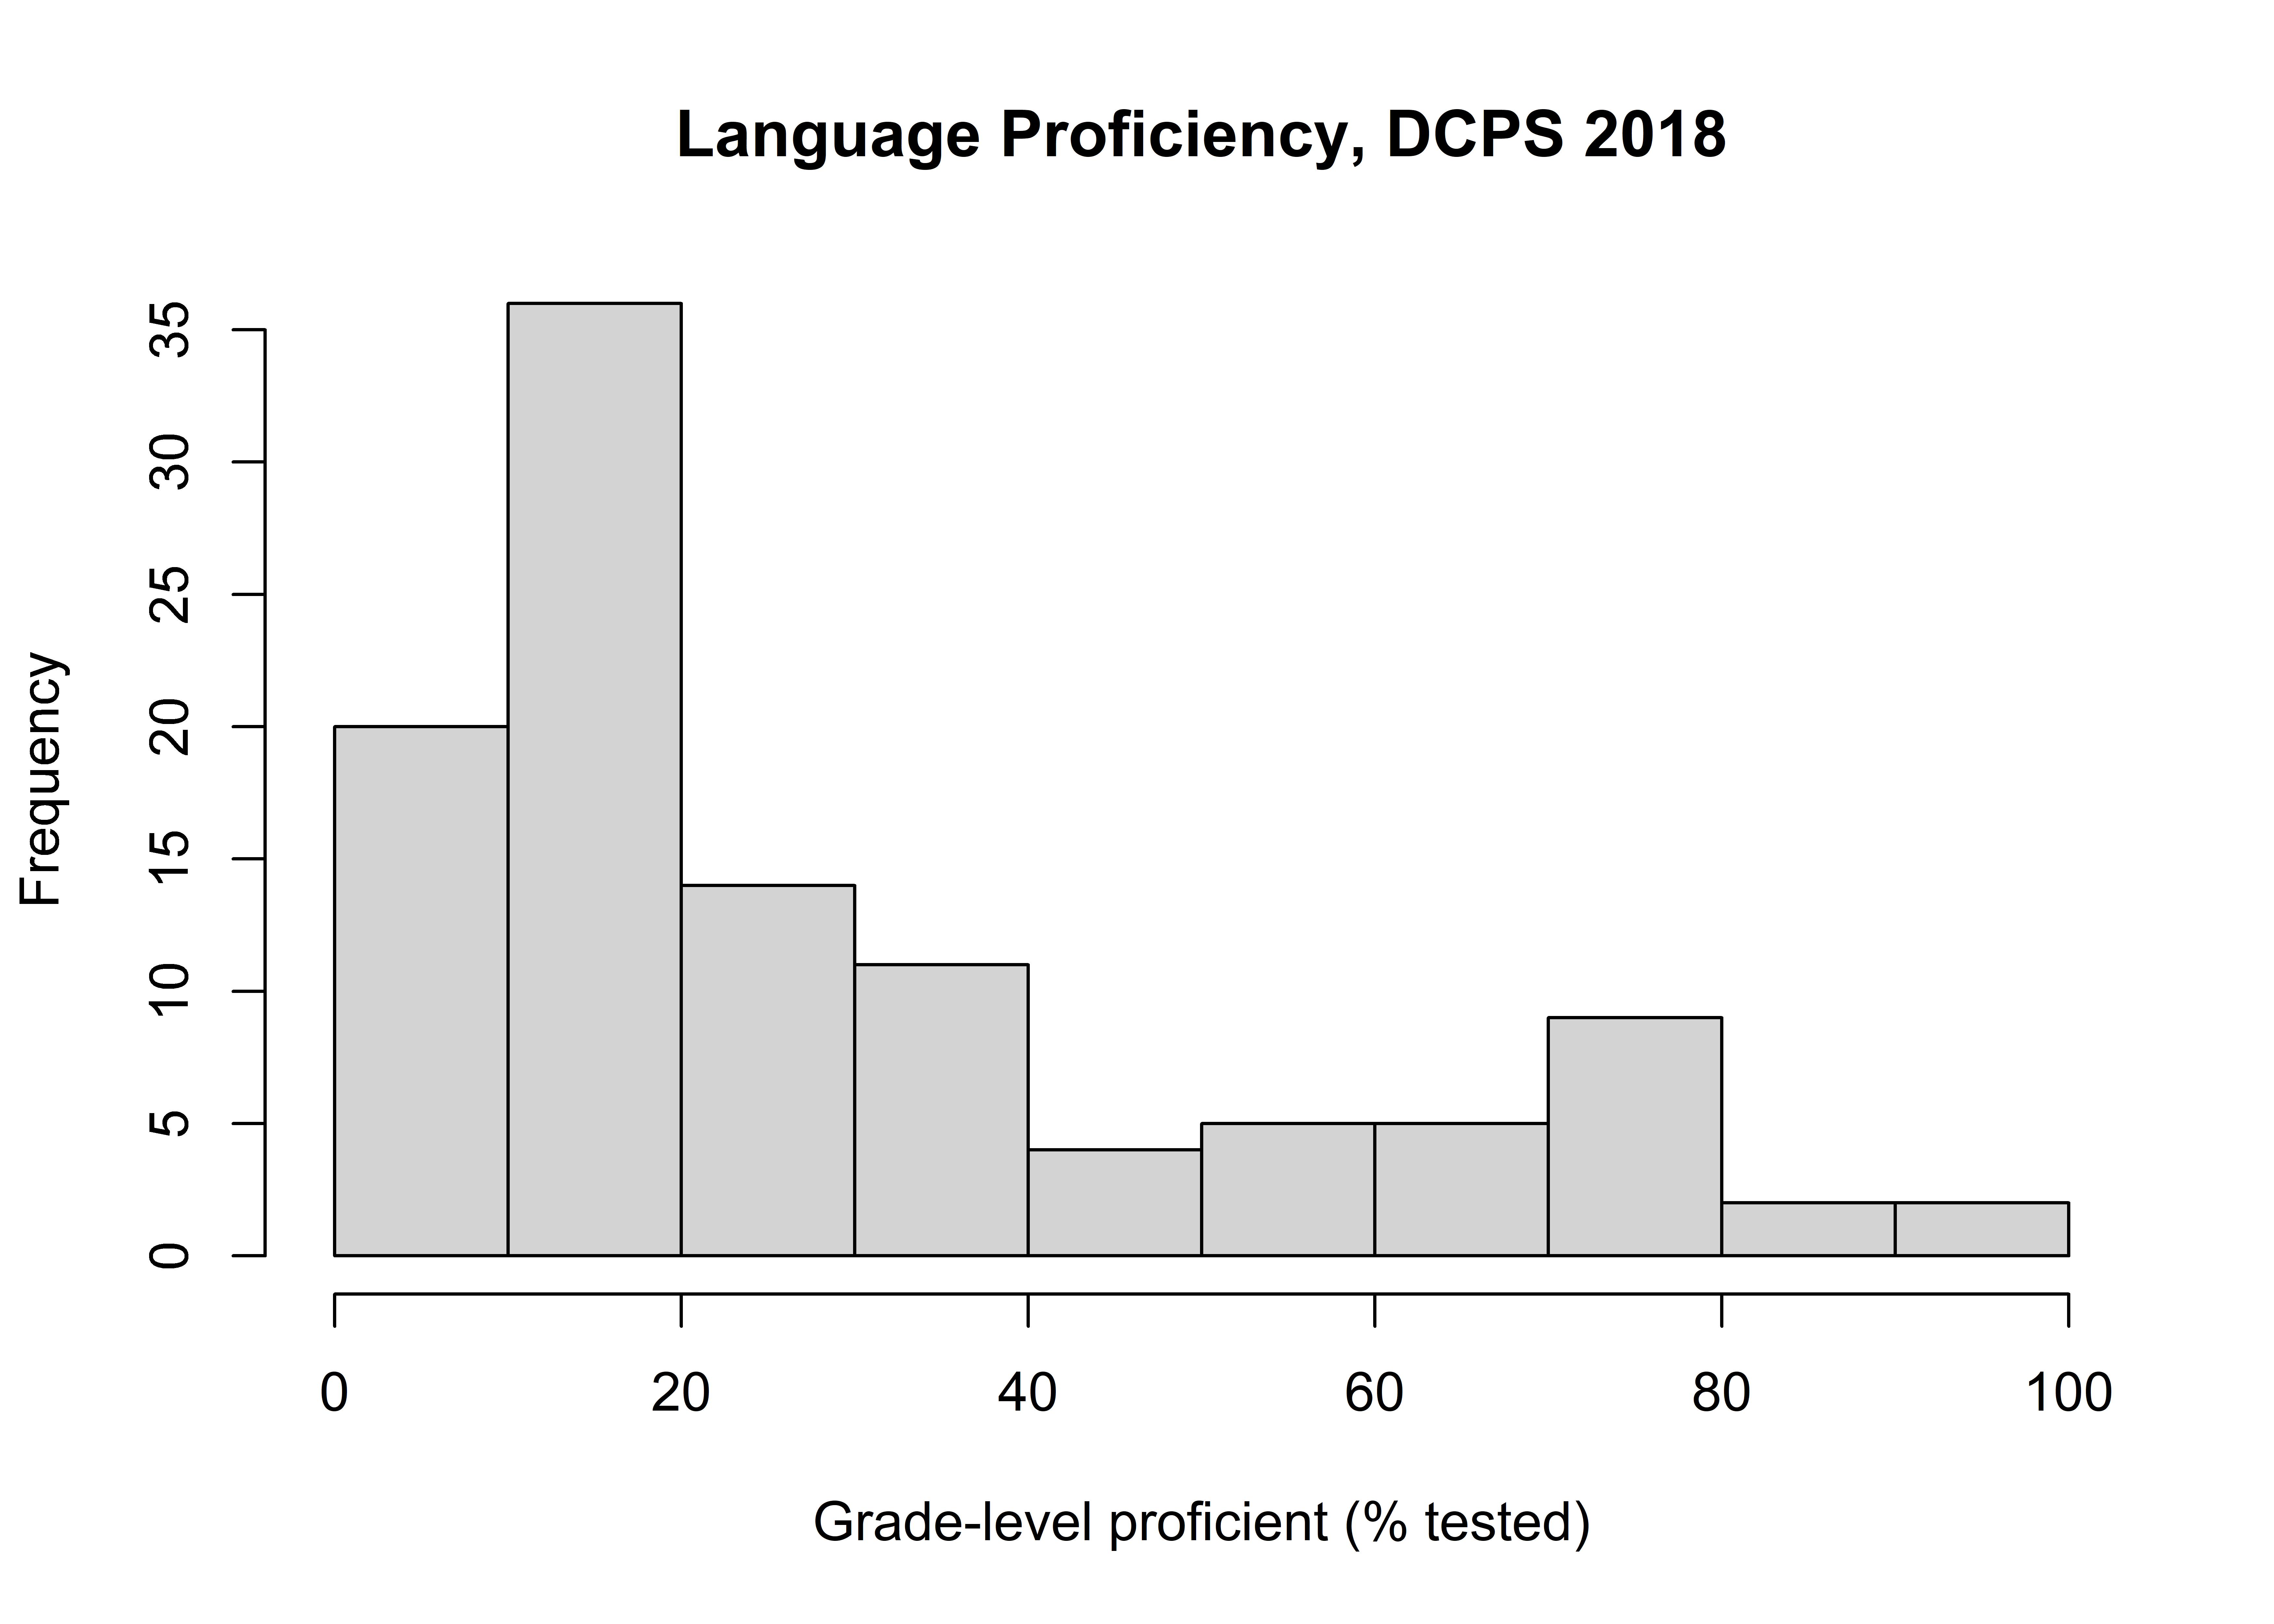
9.2.2 Axis options
Sometimes the axis scales that R chooses don’t make sense or fail to communicate effectively. In these cases, we want to format the endpoints, or limits, of each axis scale. You do this using xlim and ylim, which allow you to specify a custom minimum and maximum value on each axis (e.g. xlim = c(min,max)). Note that you must provide both using the appropriate syntax.
  plot(ProfLang ~ NumTested, data = dcps,
       xlim = c(0,1500), ylim = c(0,100)) # boundaries on X and Y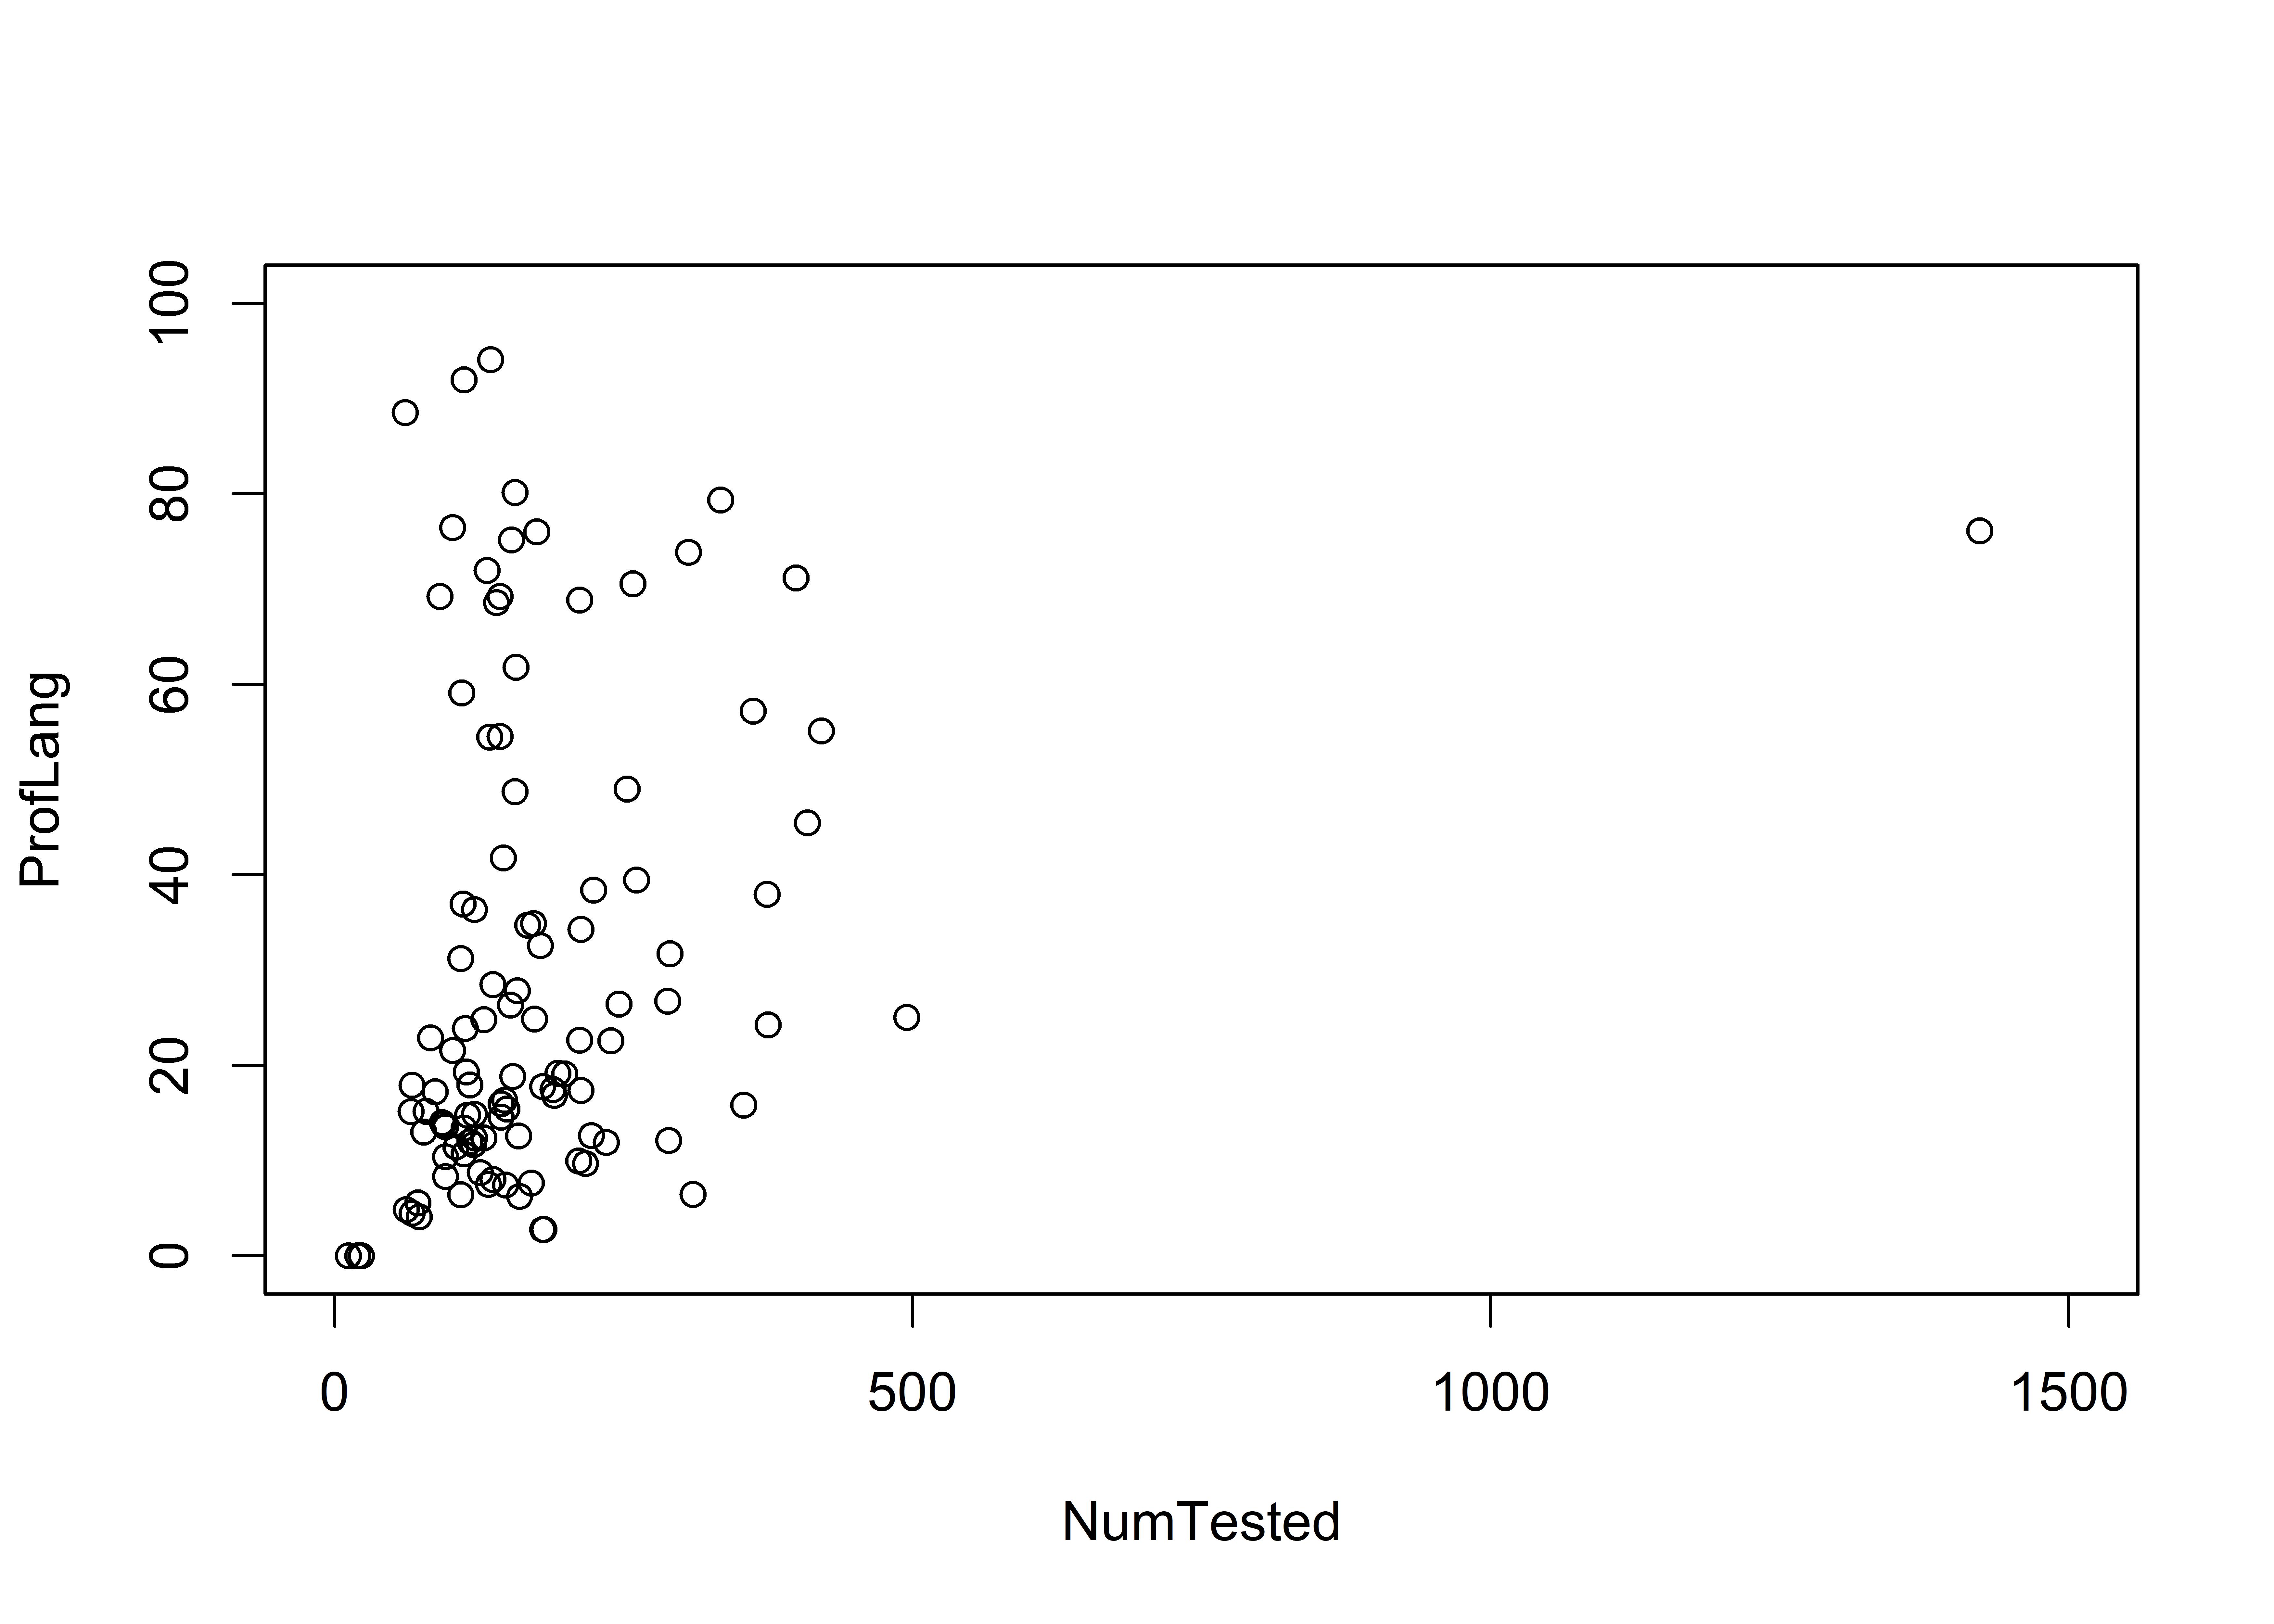
9.2.3 Graphical parameters
Basic R graphs are clean and sparse; these are important advantages. However, we may want to spice things up beyond the simple black and white. This is especially true in graphs with multiple components (e.g. a scatter plot with linear fit) where color/shape contrast is important to differentiate the elements. See below examples of changing fill color (col), border color (border), point shape (pch), line type (lty), and line width (lwd).
# Histogram (or boxplot)
  hist(dcps$ProfMath,
       col = 'deeppink4', # fill color
       border = 'gray25') # broder color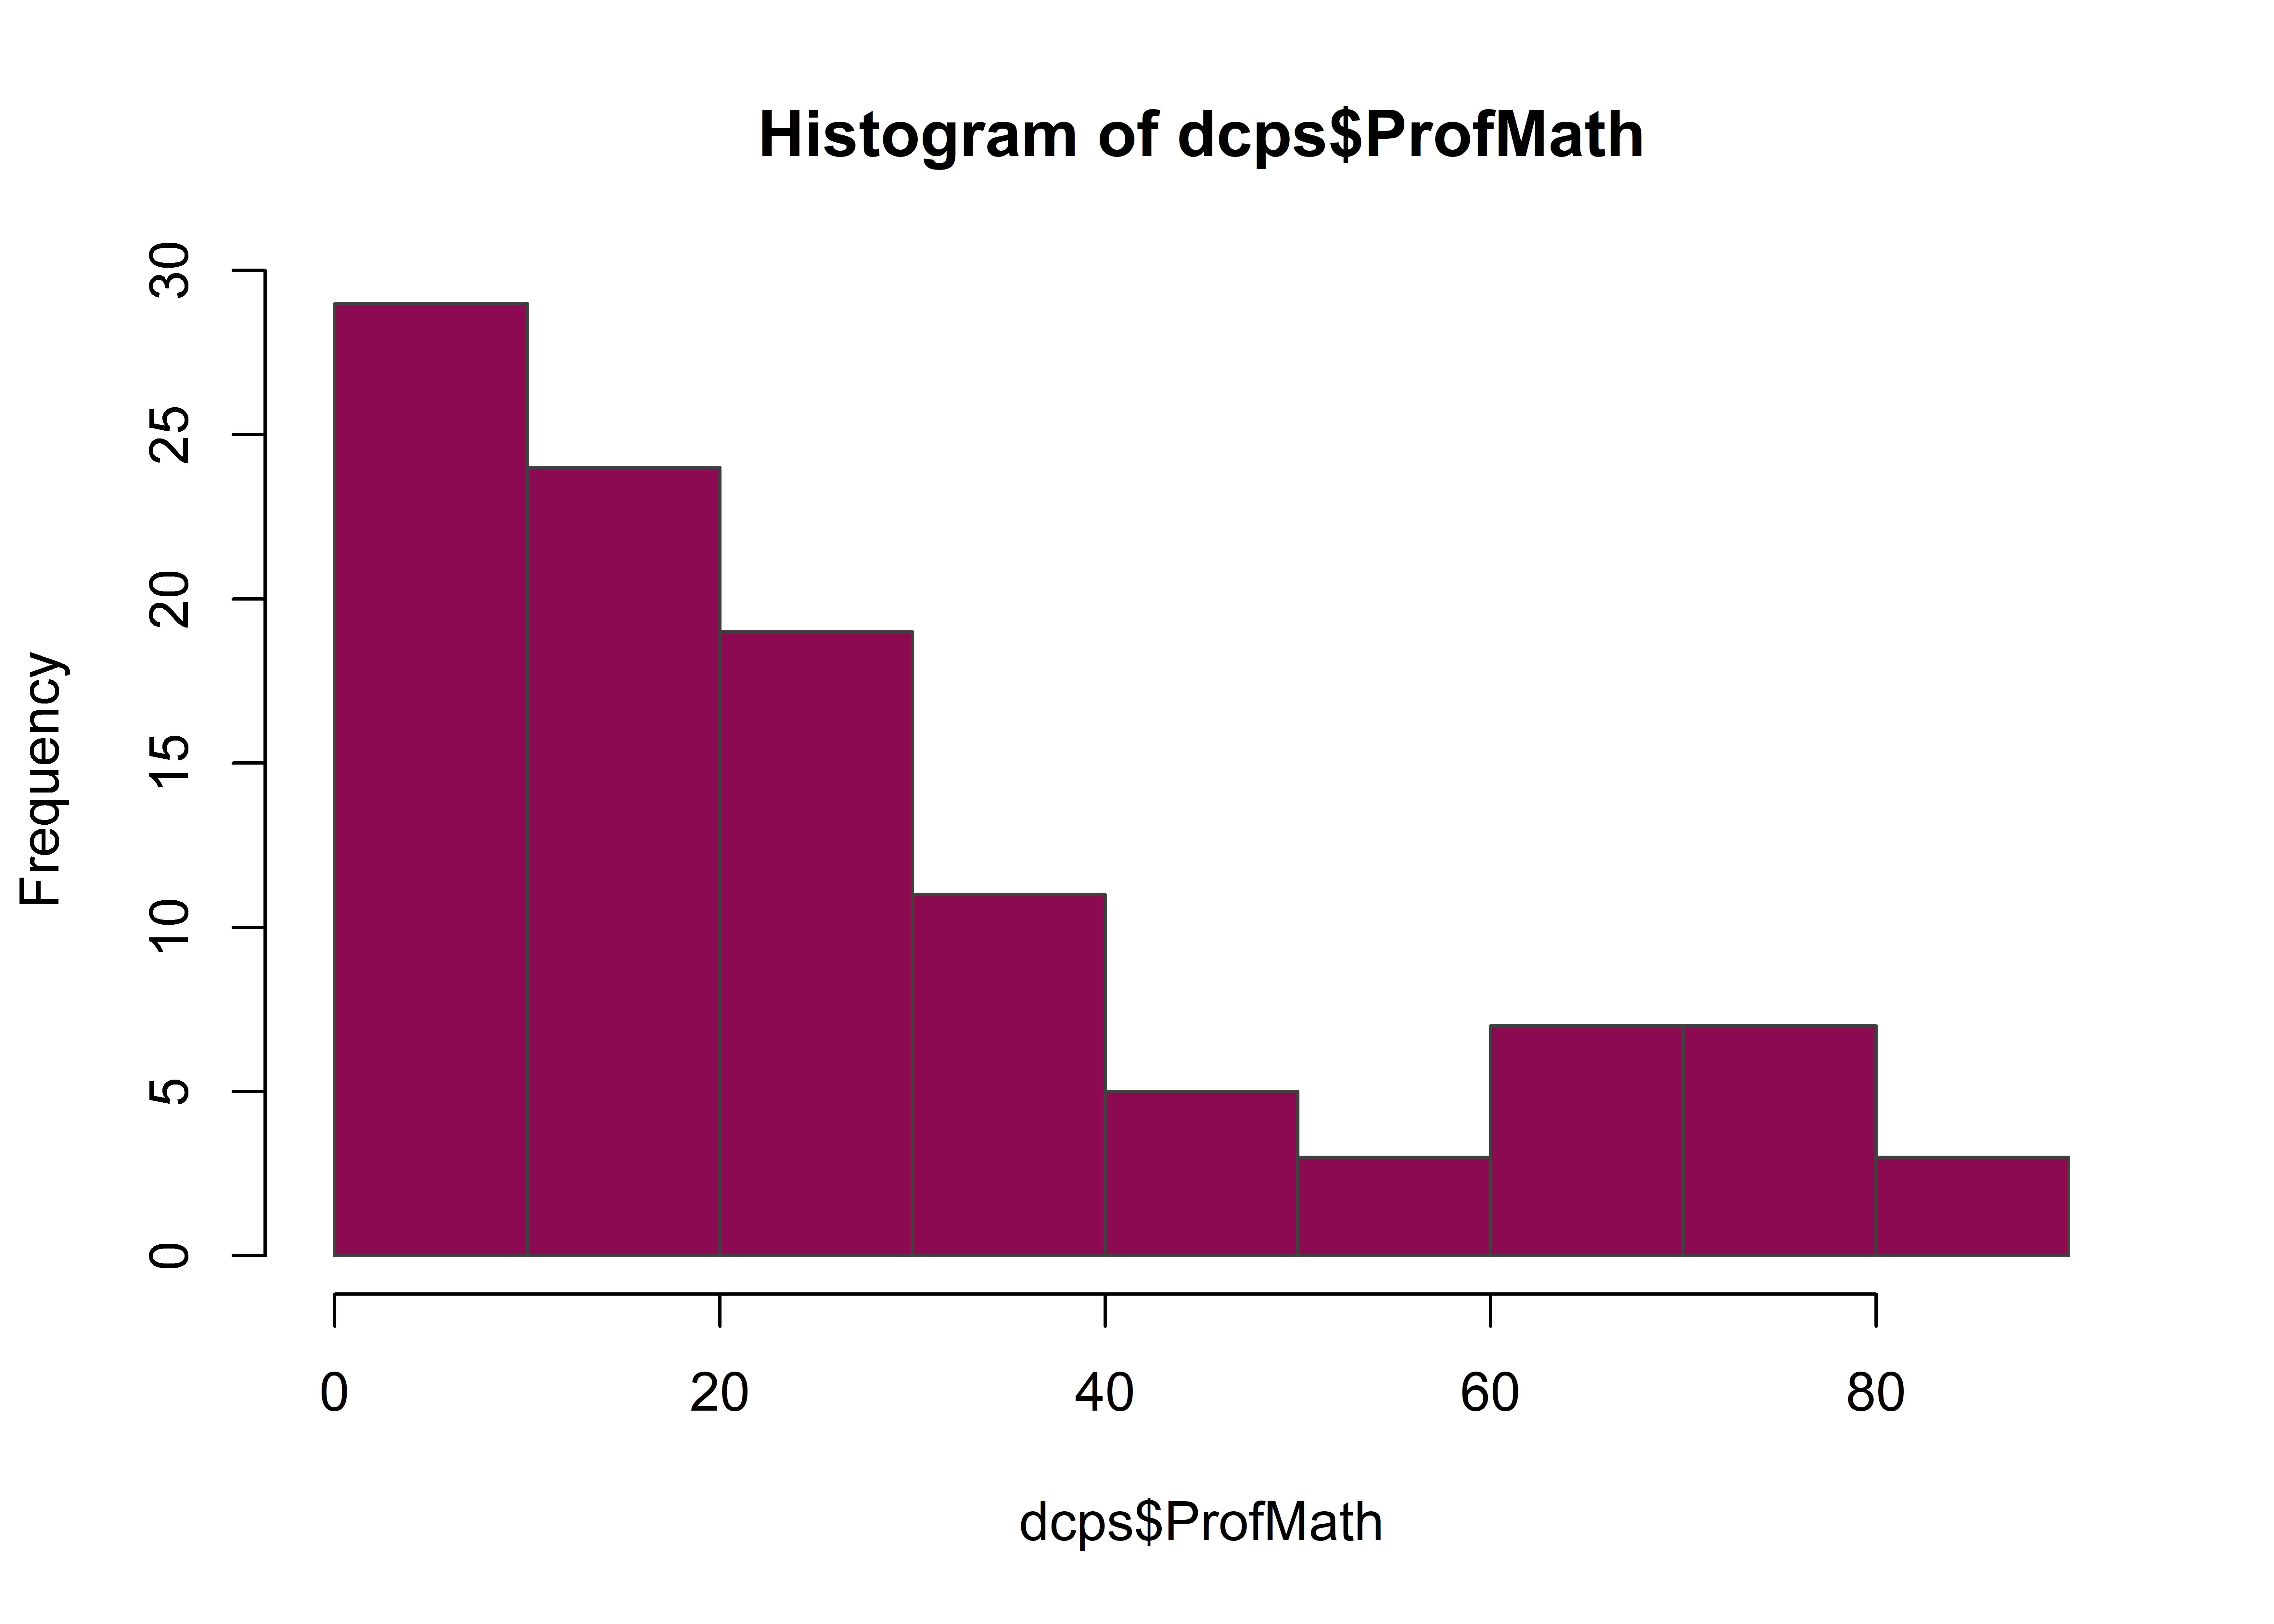
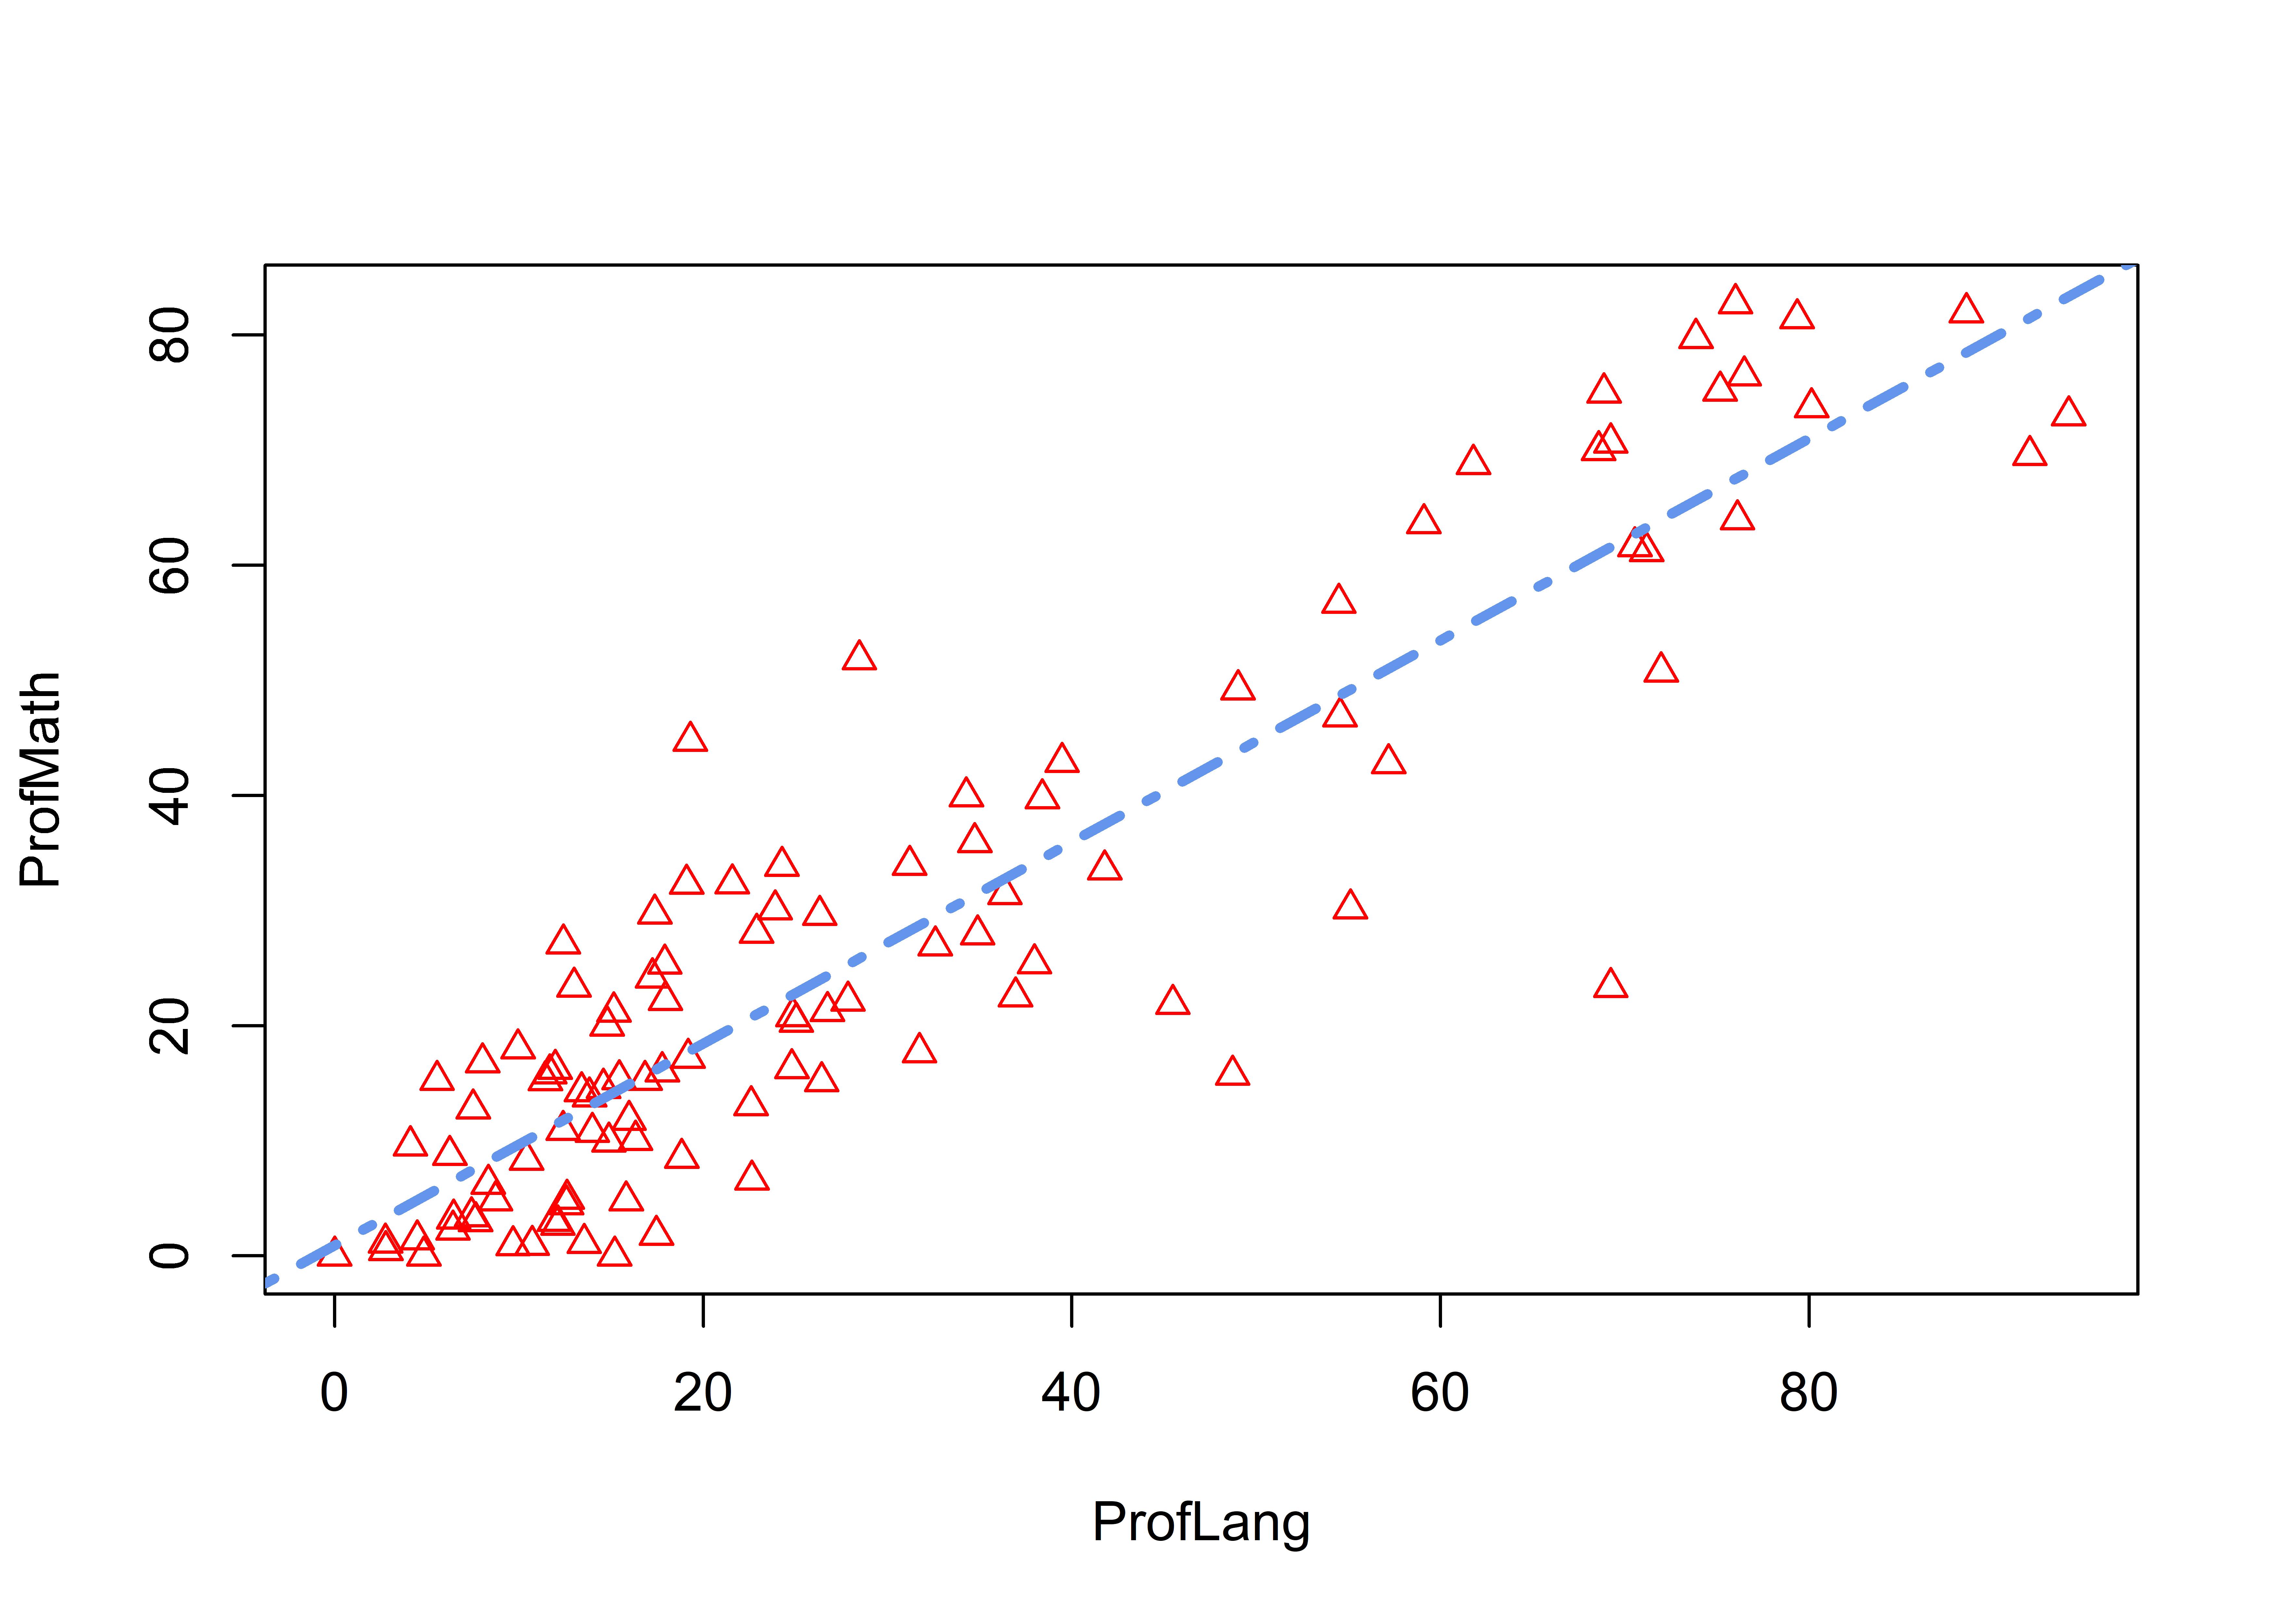
# Scatter plots with fit
  plot(ProfMath ~ ProfLang, data = dcps,
       pch = 24,    # shape of the point
       col = 'red') # point color

  abline(lm(ProfMath ~ ProfLang, data = dcps),
         col = 'cornflowerblue',
         lty = 4, # line type (1-6)
         lwd = 3) # line width (3=triple width)