6.1 Describing one variable
6.1.1 Frequency tables
The count() function in tidyverse creates a tibble with each value of the variable and the “count” of observations within.
# Frequency table
  Tab =
    film %>%   # the dataset
    count(SubjectSex) # the variable to count

  Tab
## # A tibble: 2 x 2
## SubjectSex n
## * <chr> <int>
## 1 Female 177
## 2 Male 584Calculating the the percent of total cases in each category (relative frequency) requires an extra line of code (mutate(Percent = 100 * n/sum(n))).
# Relative frequency
  Tab =
    Tab %>%
    mutate(Percent = 100 * n/sum(n))

  Tab
## # A tibble: 2 x 3
## SubjectSex n Percent
## * <chr> <int> <dbl>
## 1 Female 177 23.3
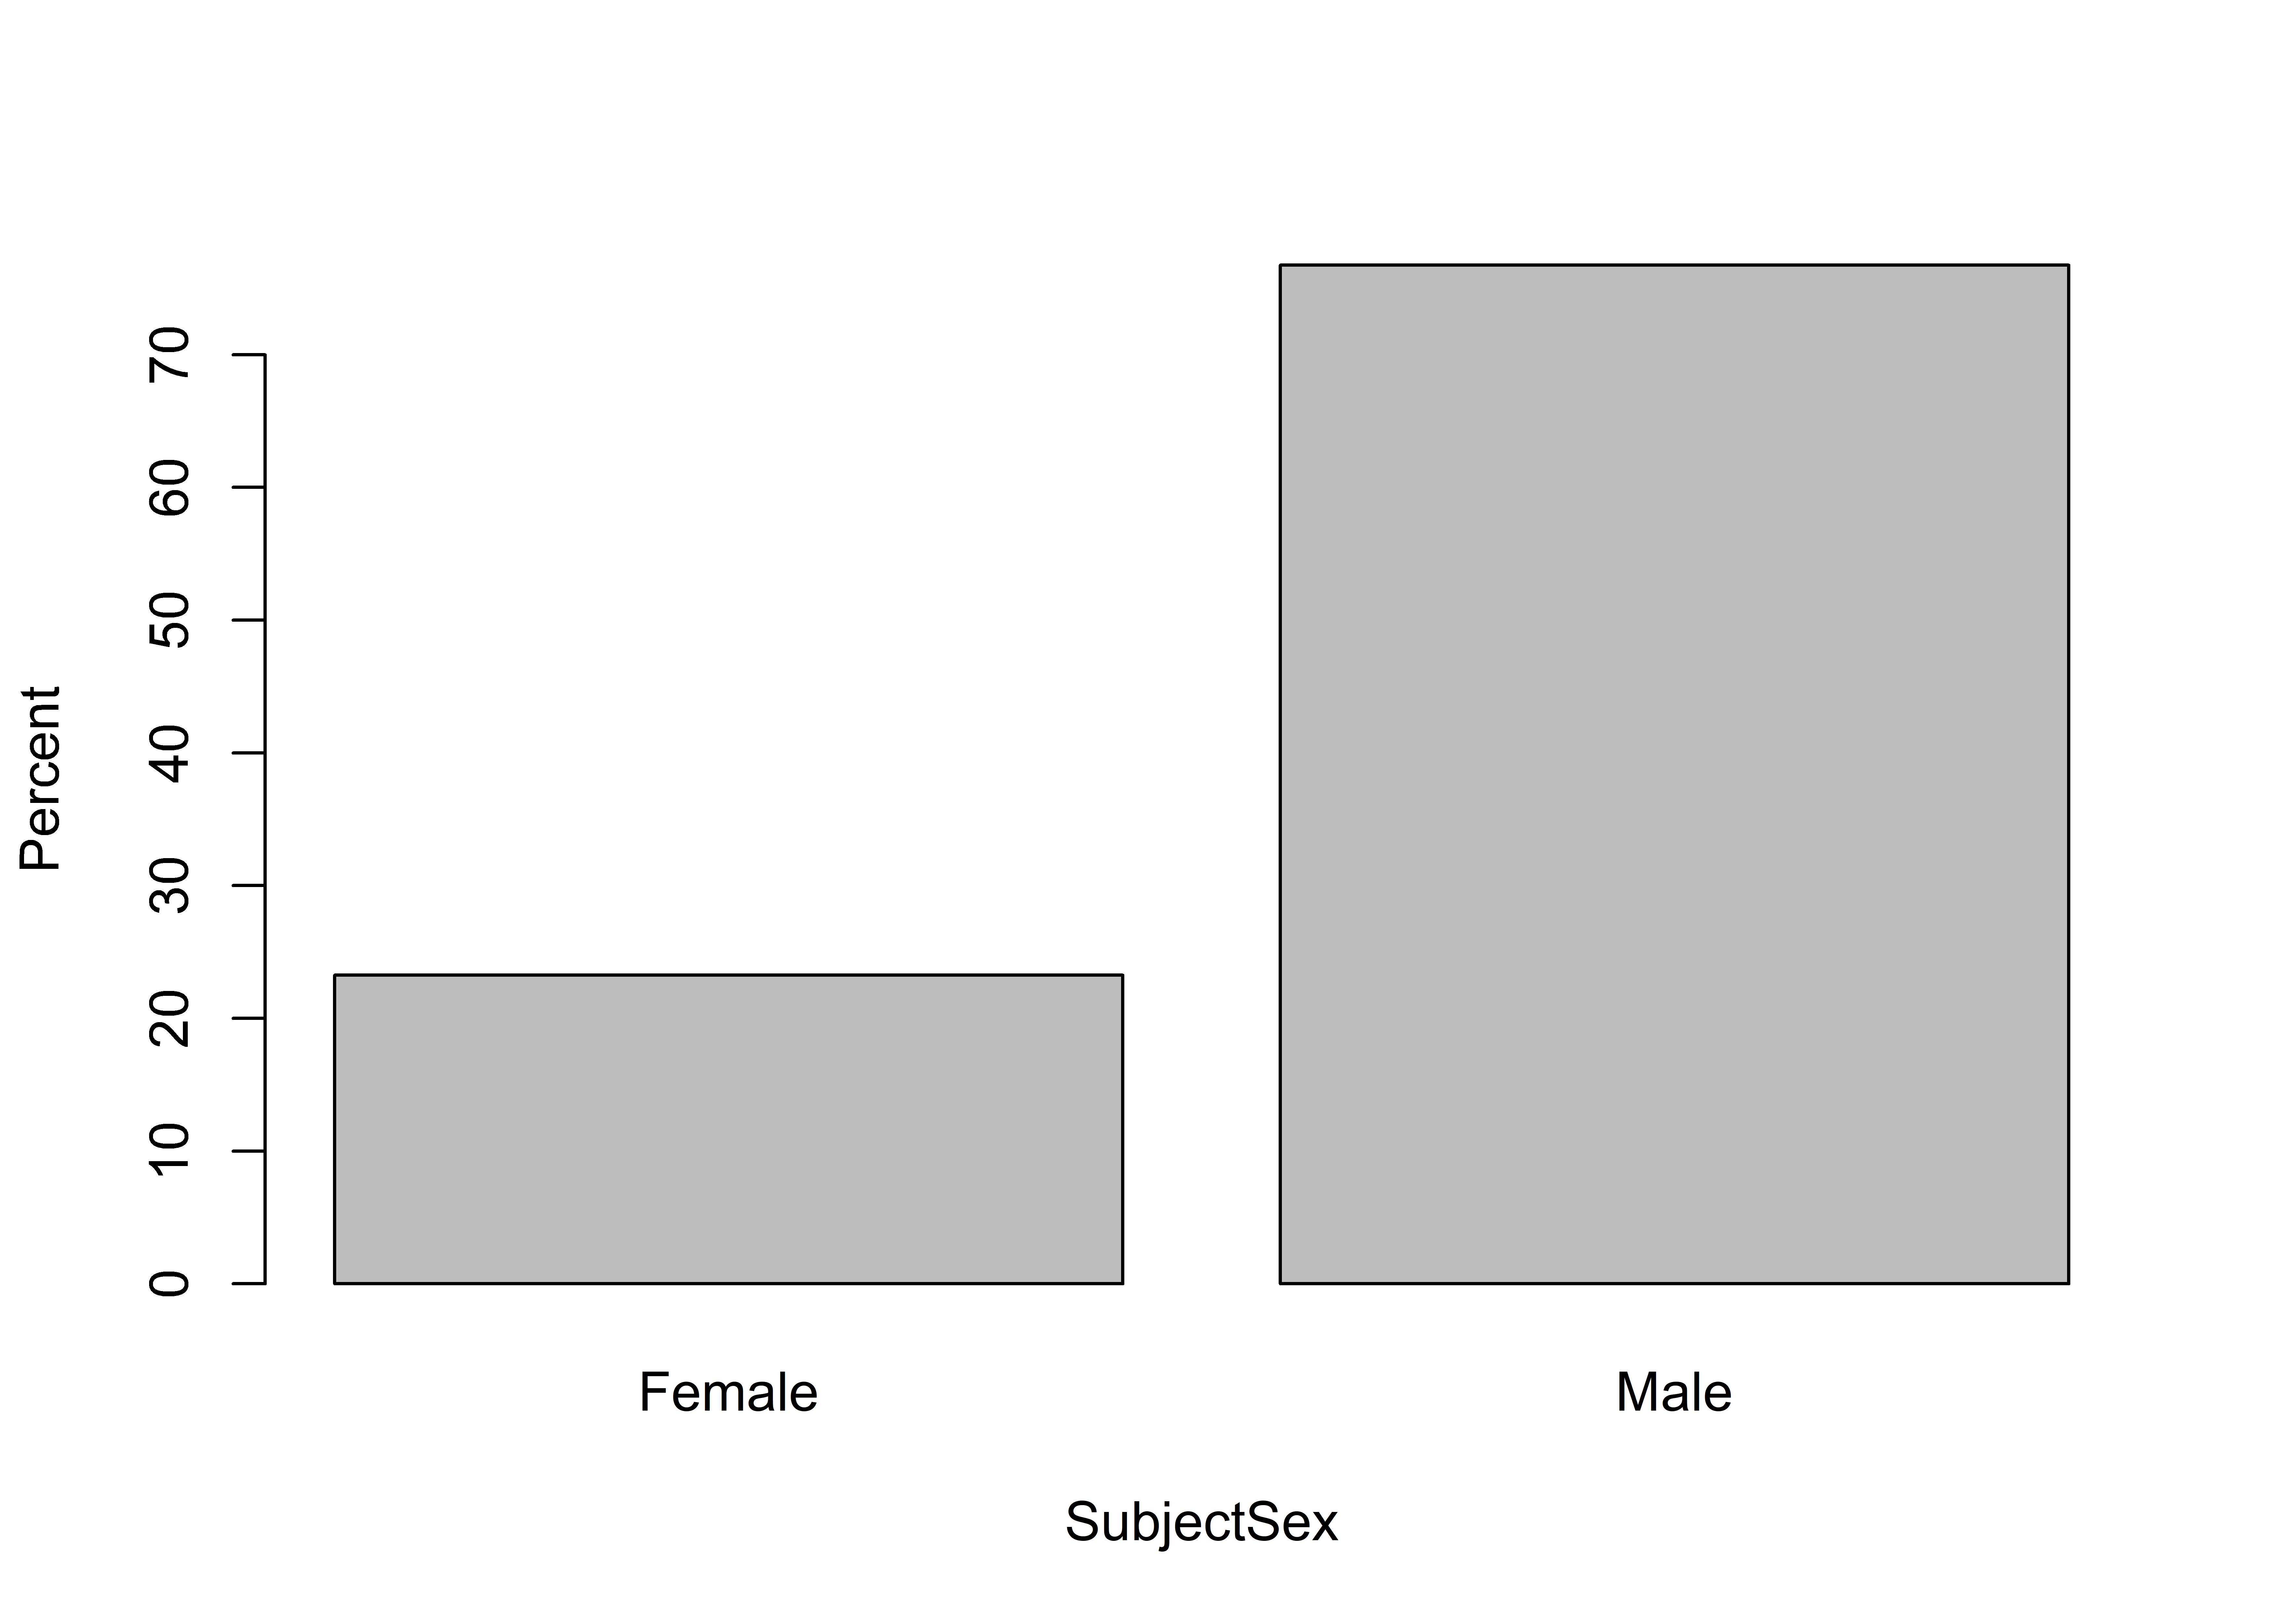
## 2 Male 584 76.76.1.2 Bar charts
Use a basic barplot() to display the results saved into these objects (rawTab). Note the notation here is barplot(count ~ category, data):
barplot(n ~ SubjectSex, Tab)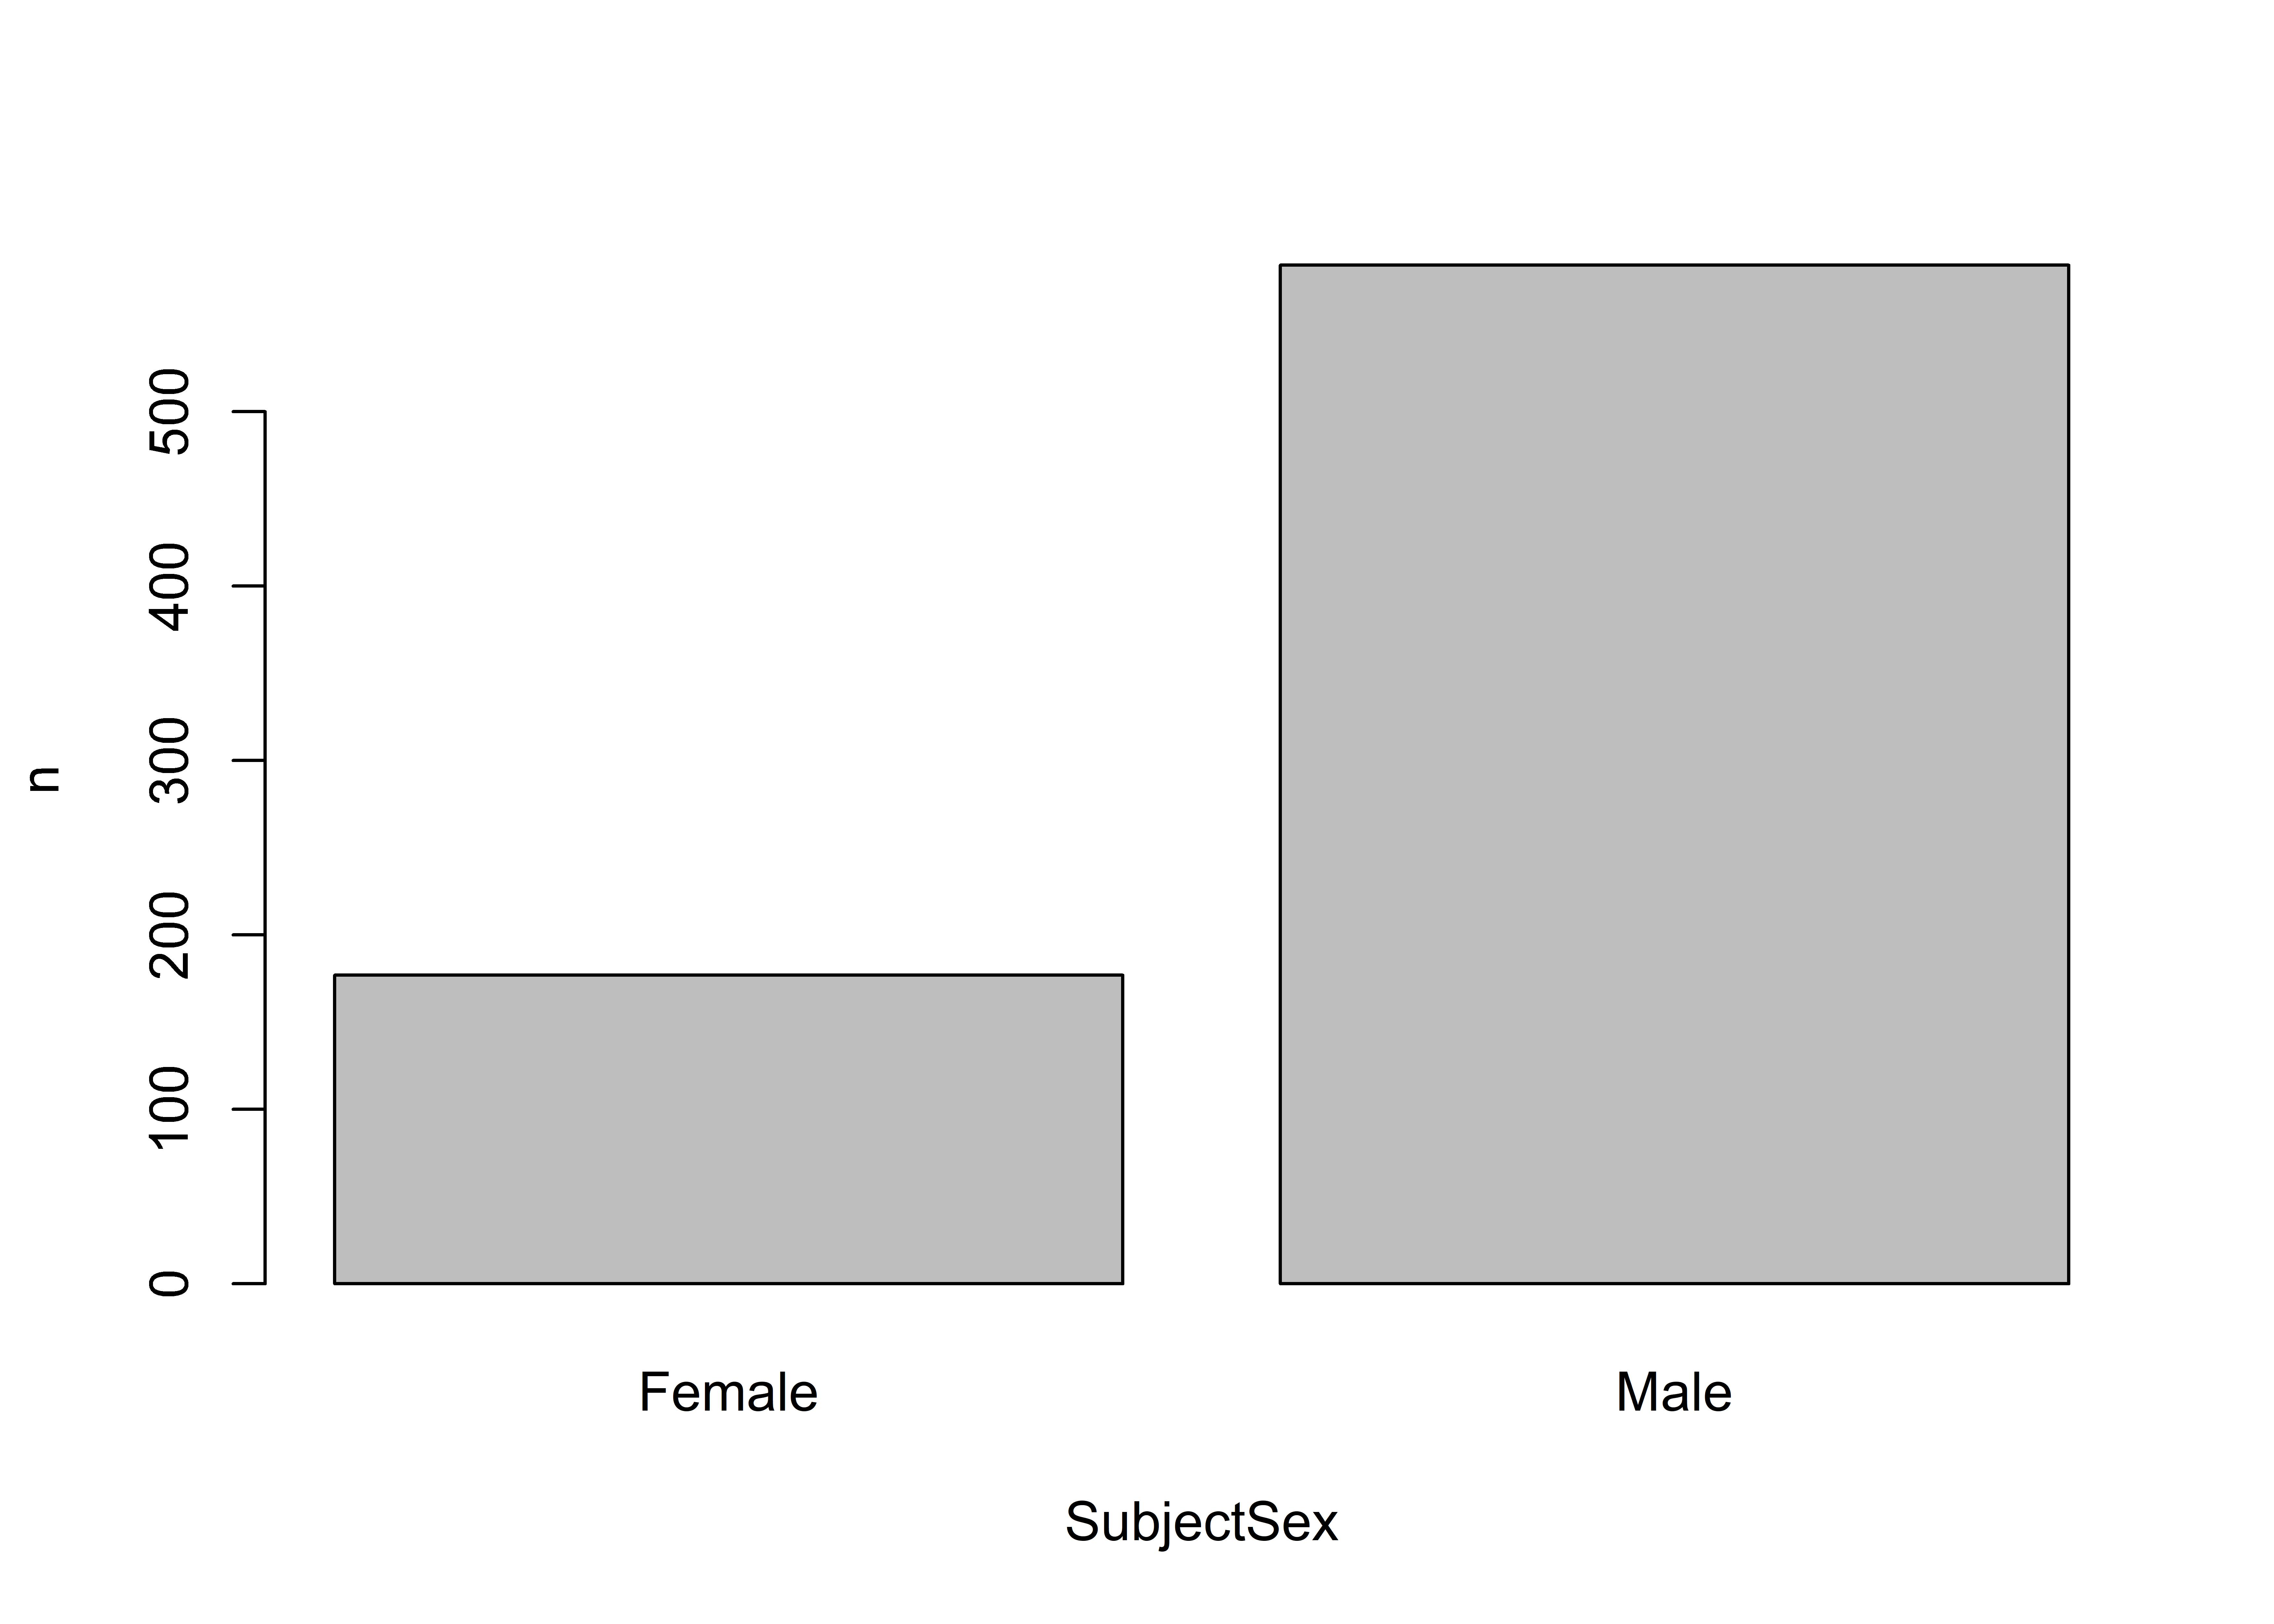
barplot(Percent ~ SubjectSex, Tab)