7.3 Scatter with linear fit
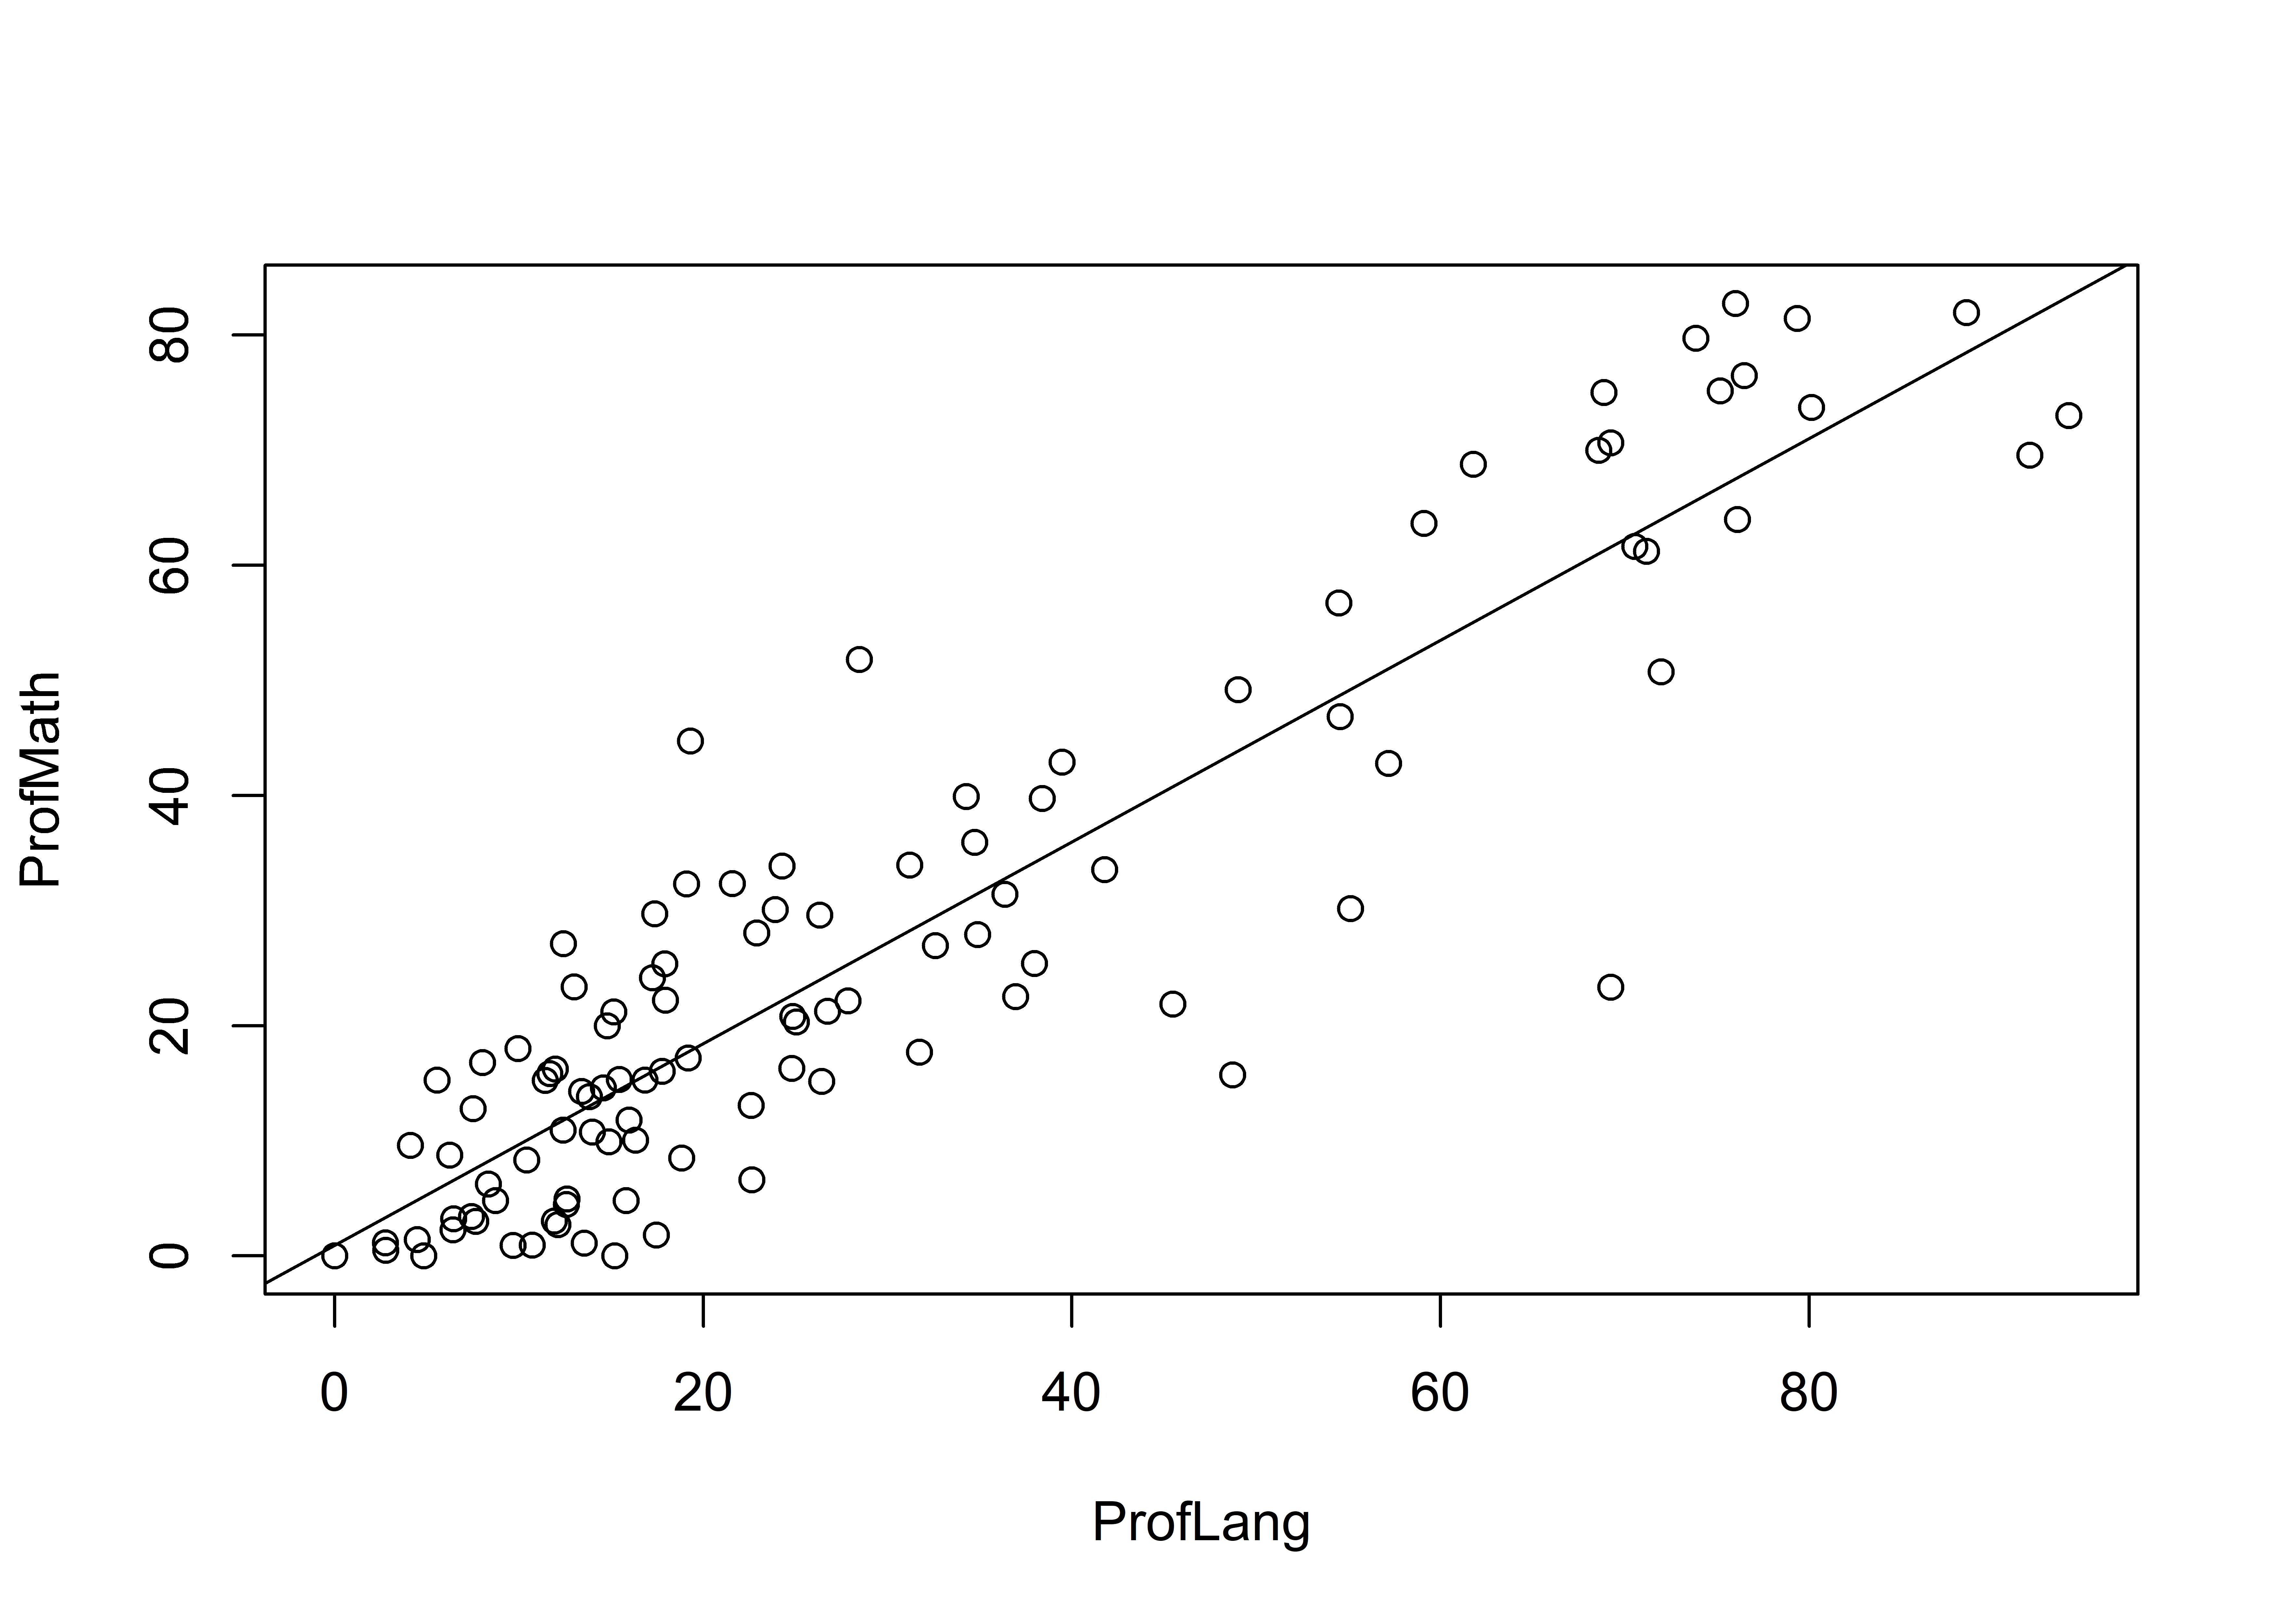
We use a scatter plot with linear fit to visualize the bivariate (unconditional) linear associations. First create the scatter with plot() and then overlay the regression line from stored estimates using abline(). Be sure to run these lines together or in succession:
  plot(ProfMath ~ ProfLang, dcps) # basic scatter
  abline(Model1)   # Add stored linear estimate